You have an installation of Graphite, a desire to learn more Ruby, and some festive spirit – what emerges?
An xmas tree drawn using proper metrics via the Ruby graphite gem, of course!
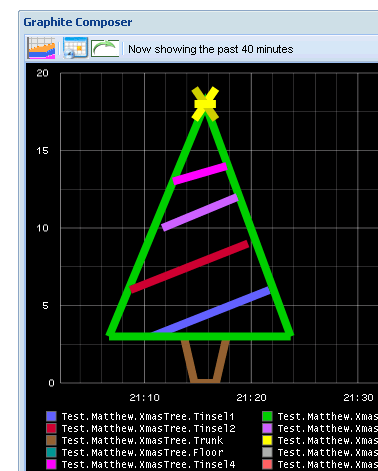
The magic happens with the Graphite::Logger class, because we can log metrics at specific points in time:
logger.log(when,{"Branches1" => 3})
I calculated the points to plot on paper, and found decent Graphite rendering settings by experimentation:

The code is on Github here: https://github.com/matthewskelton/GraphiteGreetings – fork away!
| require 'Graphite' | |
| require 'Logger' | |
| # Change these as needed for your environment | |
| server = "my.graphite.server.url" | |
| log = Logger.new(STDOUT) | |
| prefix = "Test.Me.XmasTree." | |
| # Create the logger to send stats to Graphite with specific timings | |
| logger = Graphite::Logger.new(server,log) | |
| # Define the offsets | |
| # | |
| # Use Now as a starting point, | |
| # or set a specific time e.g. Time.utc(2012,12,22,19,10,30) | |
| # We need a 20-minute window to plot | |
| t = Time.now | |
| t0 = Time.at(t.to_i - (20 * 60)) # 20 mins ago | |
| t1 = Time.at(t0.to_i + (60 * 1)) # Left base of tree | |
| t2 = Time.at(t0.to_i + (60 * 3)) # Lower tinsel2 | |
| # etc. | |
| # Inject the stats - the order is determined by the default Graphite colours | |
| logger.log(t21,{prefix + "Tinsel1" => 3}) | |
| logger.log(t18,{prefix + "Tinsel1" => 6}) | |
| # etc. |
I’d love to hear or see any suggestions for improvements to the script. Candles? Snowflakes? Reindeer?! Also, as my Ruby-fu is limited, if there are better ways of interacting with Graphite, I’d love the hear about them (I tried and failed to get activesupport to work on my machine, for example).
