Build screens (or build monitors, or information radiators) are an important tool in helping to achieve Continuous Integration and in trapping errors early. When the number of build jobs becomes large, it can be tempting to hide ‘successful’ jobs to save space, but we found this to cause problems. I realised that people need to know the context for the red jobs if they are to take prompt action to fix failing builds, so it’s important to represent the full state of all builds by showing green jobs too.
The WordPress.com stats helper monkeys prepared a 2012 annual report for this blog.
Here’s an excerpt:
600 people reached the top of Mt. Everest in 2012. This blog got about 10,000 views in 2012. If every person who reached the top of Mt. Everest viewed this blog, it would have taken 17 years to get that many views.
This file contains hidden or bidirectional Unicode text that may be interpreted or compiled differently than what appears below. To review, open the file in an editor that reveals hidden Unicode characters.
Learn more about bidirectional Unicode characters
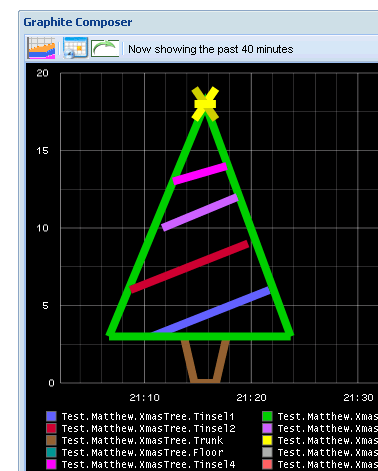
I’d love to hear or see any suggestions for improvements to the script. Candles? Snowflakes? Reindeer?! Also, as my Ruby-fu is limited, if there are better ways of interacting with Graphite, I’d love the hear about them (I tried and failed to get activesupport to work on my machine, for example).
When raising log events in code it can be difficult to choose a severity level (such as Error, Warning, etc.) which will be appropriate for Production; moreover, the severity of an event type may need to be changed after the application has been deployed based on experience of running the application. Different environments (Development (Dev), User Acceptance Testing (UAT), Non-Functional Testing (NFT), Production, etc.) may also require different severity levels for testing purposes. We do not want to recompile an application just to change log severity levels; therefore, the severity level of all events should be configurable for each application or component, and be decoupled from event-raising code, allowing us to tune the severity without recompiling the code.
A simple way to achieve this power and flexibility is to define a set of known event IDs by using a sparse enumeration (enum in C#, Java, and C++), combined with event-ID-to-severity mappings contained in application configuration, allowing the event to be logged with the appropriate configured severity, and for the severity to be changed easily after deployment.
I recently went to a Devs in the ‘Ditch meetup at 7digital to hear Chris O’Dell (@ChrisAnnODell) explain 7digital’s journey to Continuous Delivery and Steve Freeman (@sf105) speak on GOOS and system testing. We had some useful discussions on dependency injection and how to use logging well, and Steve’s perspectives on ‘code shapes’ and the purpose of tests were revealing.